Espad Organization Management: Simplifying Hierarchical Complexity
Overview
The Organization Management App is designed to streamline the process of managing and visualizing complex organizational structures for businesses, particularly those with multiple sub-companies or departments. This project is part of the Espad B2B SaaS platform, tailored for B2B (Business-to-Business) clients, aiming to provide a user-friendly interface that minimizes cognitive load, especially when accessed on mobile devices. The primary objective is to enable users to easily add, modify, and view their company’s hierarchical structure without overwhelming them with information or complicated navigation.
The Organization Management App is designed to streamline the process of managing and visualizing complex organizational structures for businesses, particularly those with multiple sub-companies or departments. This project is part of the Espad B2B SaaS platform, tailored for B2B (Business-to-Business) clients, aiming to provide a user-friendly interface that minimizes cognitive load, especially when accessed on mobile devices. The primary objective is to enable users to easily add, modify, and view their company’s hierarchical structure without overwhelming them with information or complicated navigation.
Key features of the app include:
- Intuitive Chart System: Allows users to add sub-companies and departments in a clear, hierarchical chart format.
- Detailed Information Management: Each sub-company or department can store specific details, ensuring comprehensive data management.
- Optimized Mobile Experience: Special emphasis on ensuring that the app is easy to use on mobile devices, with a focus on reducing cognitive load through simplified interfaces and streamlined processes.
- User-Centric Design: The app is built with the end-user in mind, ensuring that even non-technical users can navigate and manage their organizational structures with ease.
Problem statement
Businesses with complex organizational structures often face significant challenges in managing and visualizing their hierarchies. Traditional methods of organizational management can be cumbersome, inefficient, and overwhelming, especially when accessed on mobile devices.
Businesses with complex organizational structures often face significant challenges in managing and visualizing their hierarchies. Traditional methods of organizational management can be cumbersome, inefficient, and overwhelming, especially when accessed on mobile devices.
The primary issues include:
1. High Cognitive Load: Users frequently experience difficulty in navigating and understanding the intricate details of their organizational hierarchy, leading to errors and inefficiencies.
2. Lack of Mobile Optimization: Many existing solutions fail to provide an intuitive and streamlined experience on mobile devices, which are increasingly used for business management on-the-go.
3. Data Management Complexity: Ensuring that each sub-company or department has its specific details accurately recorded and easily accessible is often challenging, leading to data inconsistencies and management overhead.
The Organization Management App addresses these pain points by offering a SaaS-based, B2B solution that simplifies the process of adding, modifying, and viewing organizational structures.
Project Goals
1. Minimize Cognitive Load:
- Design an intuitive user interface that simplifies the visualization and management of complex organizational structures.
- Ensure that users can easily navigate through different levels of the hierarchy without feeling overwhelmed.
2. Optimize for Mobile Experience:
- Create a responsive design that offers a seamless and efficient user experience on mobile devices.
- Prioritize mobile usability to cater to the increasing number of users managing their organizations on-the-go.
3. Improve Efficiency:
- Streamline the workflow for managing organizational hierarchies, reducing the time and effort required for administrative tasks.
- Provide tools that enhance overall business productivity and decision-making.
4. Deliver a SaaS-Based, B2B Solution:
- Develop a scalable, cloud-based application that meets the needs of business clients.
- Offer features and functionalities tailored to the requirements of B2B operations, ensuring reliability and security.
Design Process
Interview
Conducted a few direct interviews with potential users with similar personas. The majority of the users were business owners and clients of my client.
Conducted a few direct interviews with potential users with similar personas. The majority of the users were business owners and clients of my client.
Conducted in-depth interviews with stakeholders to gather insights into their needs and pain points. This helped us understand the specific challenges they face in managing organizational structures.
Conducted in-depth interviews with stakeholders to gather insights into their needs and pain points. This helped us understand the specific challenges they face in managing organizational structures.
Competitor Analysis
Identifying Direct and Indirect Competitors
Feature Mapping
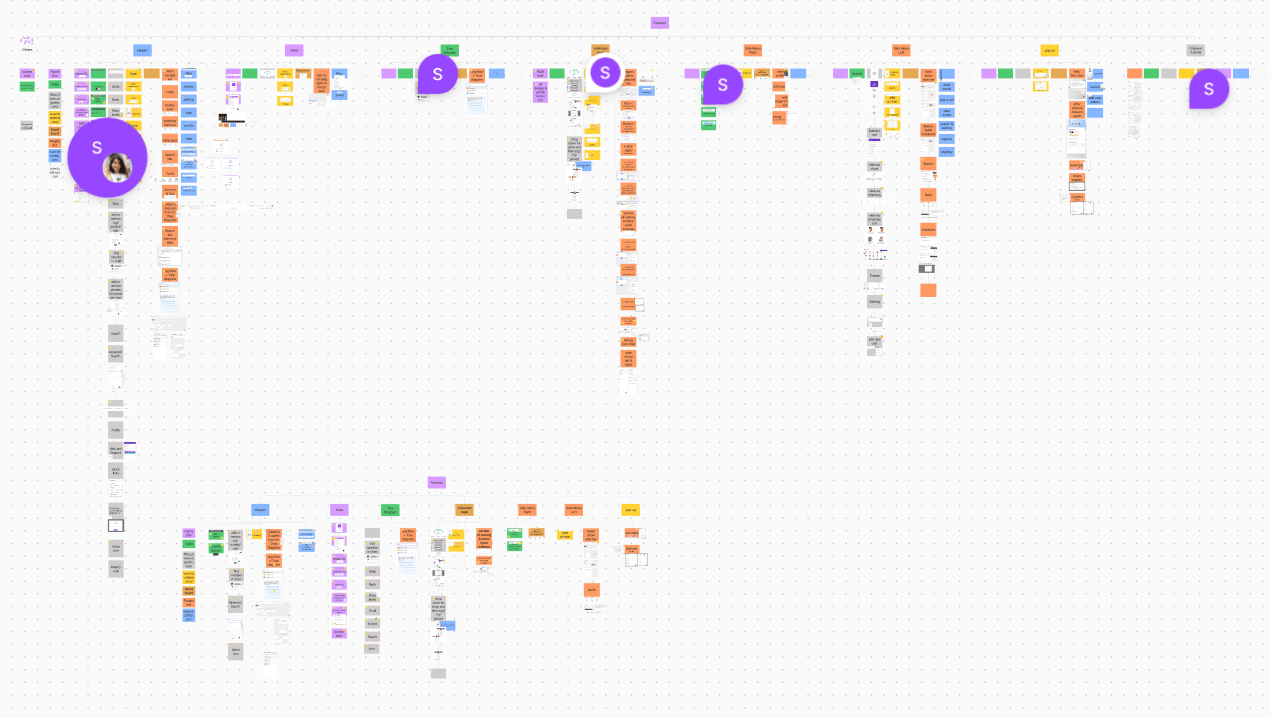
Created a visual table to map out the features required for the app. This table was based on the research findings, stakeholder interviews, and competitor analysis. It helped prioritize features that would provide the most value to users and ensure a user-friendly experience.
Feature Mapping
Created a visual table to map out the features required for the app. This table was based on the research findings, stakeholder interviews, and competitor analysis. It helped prioritize features that would provide the most value to users and ensure a user-friendly experience.
Each color represents a different competitor.
Each color represents a different competitor.
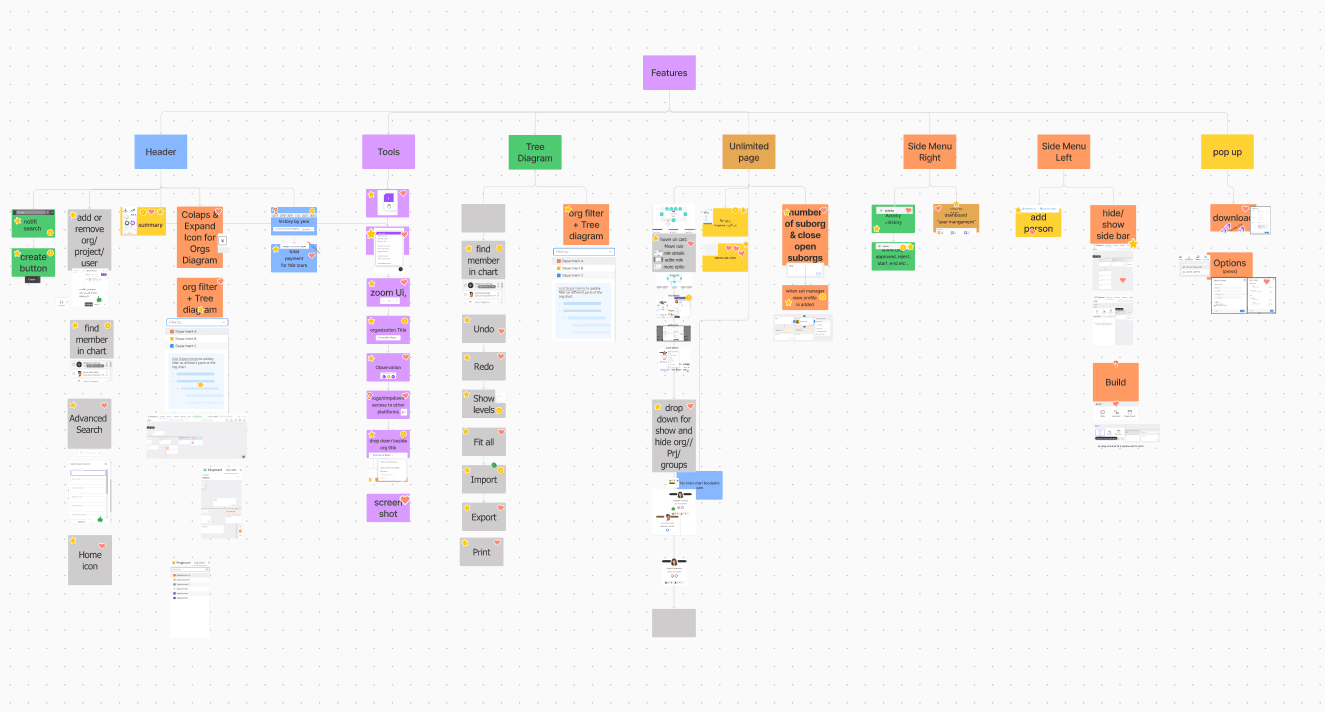
Version Control
In our project, Version Control was integral to managing the application's evolution. Through competitor analysis and stakeholder meetings, we developed a comprehensive list of useful features. We then prioritized these features and assigned them to specific versions for future project launches. This systematic approach ensured an efficient, collaborative, and well-documented design process.
By implementing feature tracking, we could:
Track Design Changes: Maintain a history of design iterations.
Enhance Collaboration: Coordinate effectively among team members.
Document Features: Clearly outline features included in each version.
High-Fidelity Design
Desktop

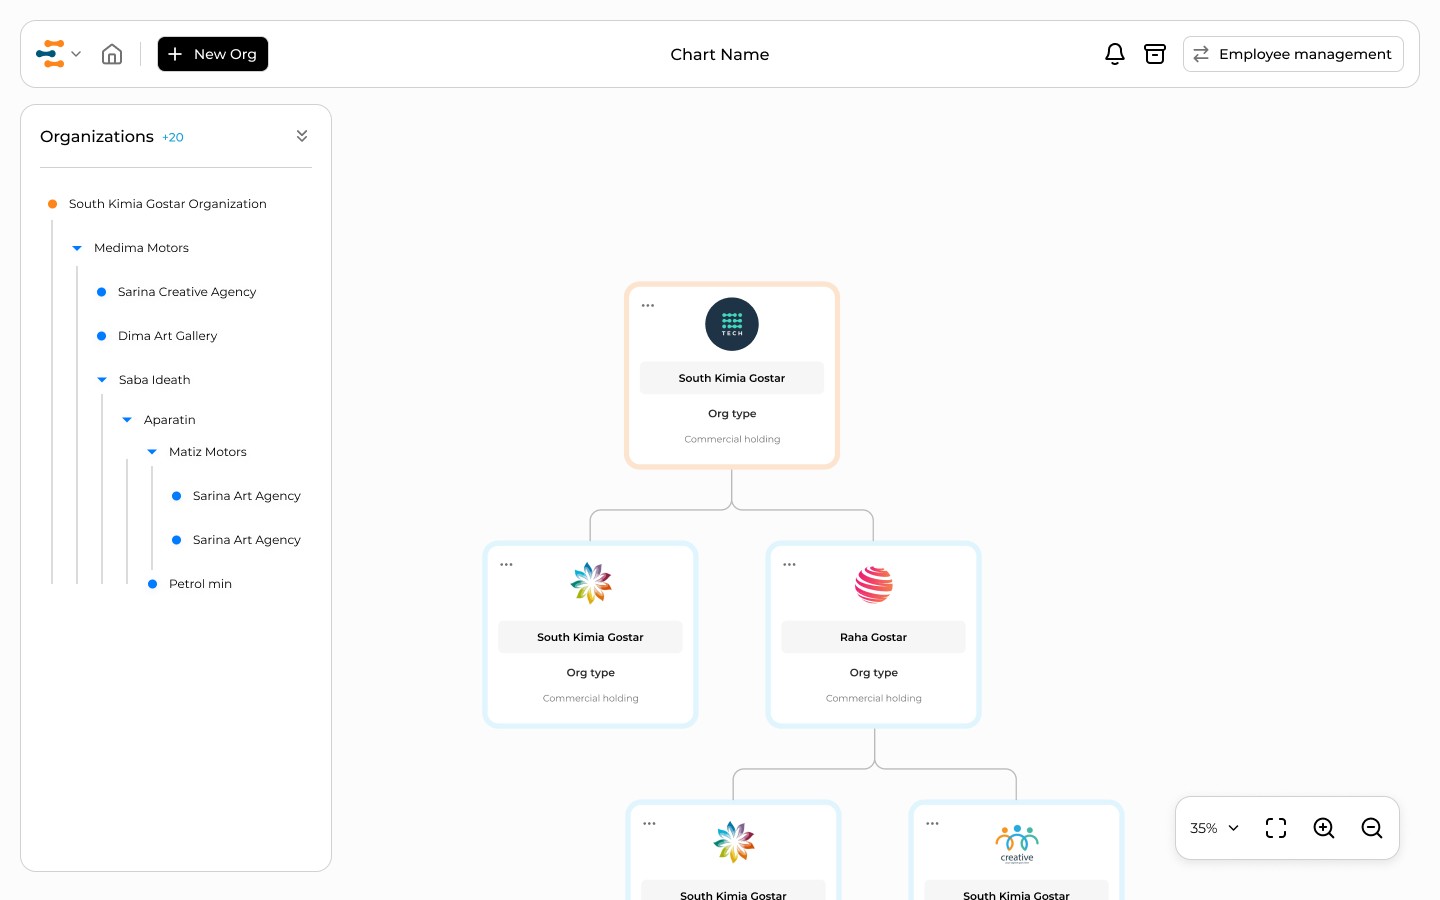
Organization Cards

Zoom-Level Adaptations for UI
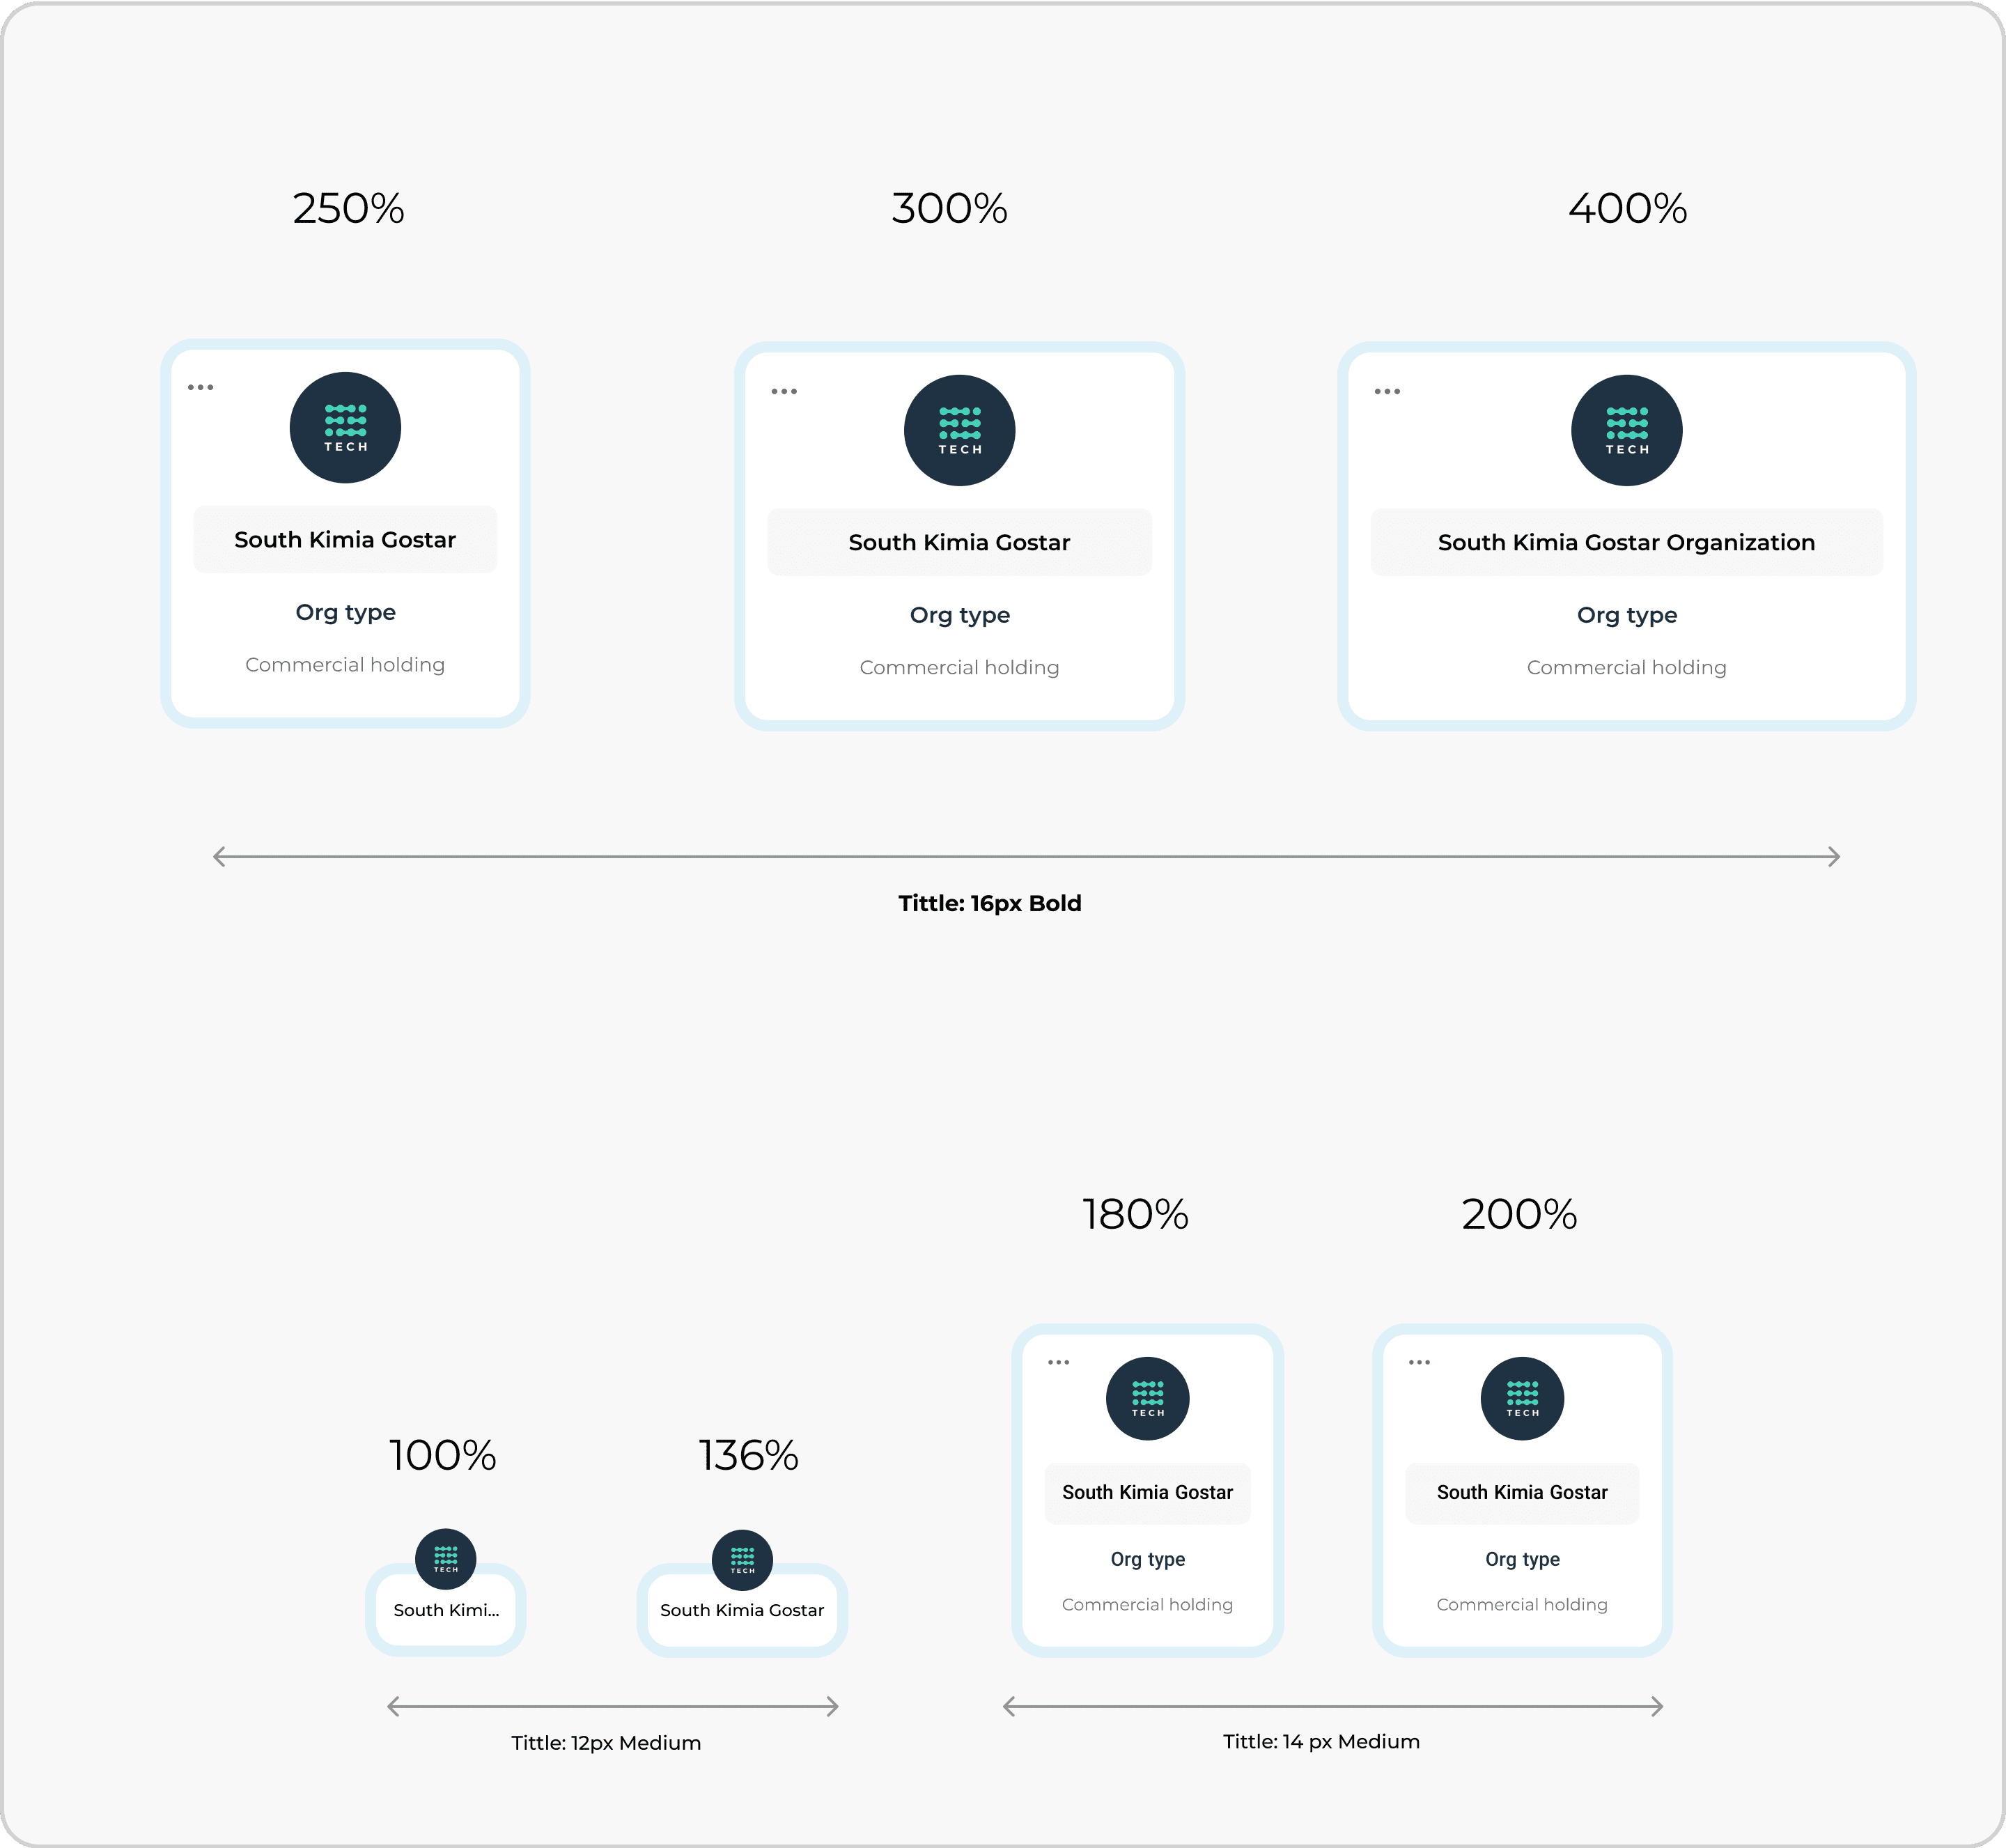
It was essential to ensure that the organization's cards remained legible and consistent across different zoom levels. To achieve this, we implemented a systematic approach:
1. Zoom Levels and Card Sizes:
250%, 300%, 400% Zoom: Cards enlarge with a proportional increase in font size, maintaining readability. (Font: 16px Bold)
100% and 136% Zoom: Smaller cards with appropriately smaller font sizes. (Font: 12px Medium)
180% and 200% Zoom: Intermediate card and font sizes to balance readability and space. (Font: 14px Medium)
2. Font Size Adjustments:-
250%, 300%, 400% Zoom: Font size remains at 16px Bold.
100% and 136% Zoom: Font size is 12px Medium.
180% and 200% Zoom: Font size is 14px Medium.
This responsive design ensures that the organizational chart remains user-friendly and readable at various zoom levels.
Mobile
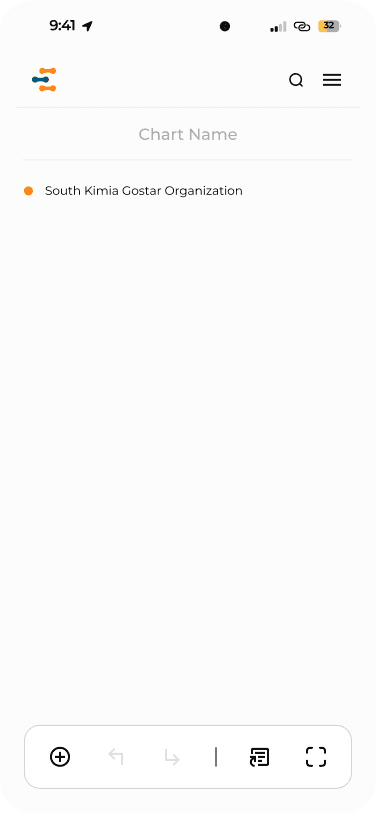
1. Accessible and Fixed Add Organization Button
A fixed button is placed in the toolbar for easy access.
Ensures users can quickly add new sub-companies or departments from any screen.
Benefit:
Simplifies the process of expanding organizational structures.
Reduces the steps needed to add new entities, enhancing user efficiency.
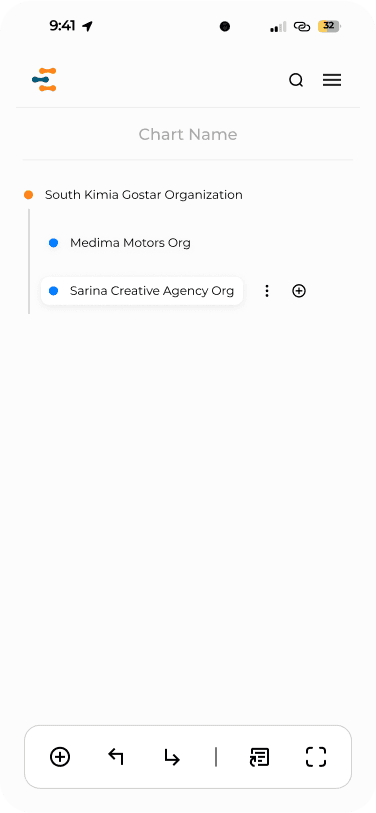
2. Contextual Click Interactions
After creating the first organization, click and select over each organization reveals a plus icon and a three-dot menu.
The plus icon allows users to add new sub-organization or departments.
The three-dot menu enables viewing, deleting and editing the selected organization.
Benefit:
Provides immediate options for managing organizations without navigating away from the current view.
Enhances usability by keeping essential functions within reach.


3. Horizontal and Vertical Scrolling for Navigation
As the number of organizations and their sub-units increase, horizontal and vertical scrolling is enabled.
Ensures all organizational structures remain accessible.
BenefitAllows users to navigate large and complex organizational charts easily.
Maintains clarity and accessibility regardless of the organization’s size.
Conclusion
The mobile-optimized design of the Organization Management App focuses on minimizing cognitive load and enhancing usability for on-the-go users. By implementing fixed action buttons, contextual interactions, intuitive navigation, and responsive scrolling, the app ensures that users can manage their organizational structures efficiently and effectively. These design solutions address the key needs of B2B clients, providing a seamless and user-friendly mobile experience.
Usability Testing for the Organization Management App
Objective: Our primary objective in selecting our user testing methods was to conduct cost-effective pre-development testing. By utilizing efficient and scalable testing strategies, we aimed to gather valuable user feedback early in the development process, reducing the risk of costly post-launch modifications.
Approach: To achieve this, we employed various user testing techniques that allowed us to gather insightful data while keeping expenses manageable. We focused on methods that provided significant user insights without requiring extensive resources.
Methods of User Testing
Moderated Usability Testing
Based on the explanations above, here is a sample of our user testing results :
Test 1: Initial Usability Test Without Onboarding
Participants: 20
Objective: Assess the initial understanding and ease of use for the navigation arrows in the organizational chart without any onboarding guidance.
Tools Used: UserTesting, Maze, Figma
Findings:
Task Completion Rate: 60% (12 out of 20 participants successfully understood and used the navigation arrows correctly on the first attempt).
Average Time to Task Completion: 3 minutes.
Success Rate: 60%
Misclick Rate: 40% (8 out of 20 participants clicked the wrong arrow or placed the organization incorrectly).
Time Spent on Task: 3 minutes on average.
Observations: A significant number of participants (8 out of 20) exhibited hesitation and confusion when attempting to use the navigation arrows. Many were unsure about the function of the arrows, leading to incorrect placements and frustration. The cognitive load was high, as evidenced by the frequent need for hints and assistance.
User Feedback: Common feedback highlighted the lack of clarity regarding the purpose and function of the arrows. Participants suggested that an introductory guide or animation would be beneficial.
Test 2: Usability Test With Onboarding Animation
Participants: 20
Objective: Evaluate the impact of an onboarding animation on users' understanding and ease of use of the navigation arrows.
Tools Used: UserTesting, Maze, Figma, After Effects
Findings:
Task Completion Rate: 100% (All 20 participants successfully understood and used the navigation arrows correctly after viewing the onboarding animation).
Average Time to Task Completion: 1.5 minutes.
Success Rate: 100%
Misclick Rate: 10% (2 out of 20 participants initially clicked the wrong arrow but quickly corrected themselves).
Time Spent on Task: 1.5 minutes on average.
Observations: The onboarding animation significantly improved users' understanding and reduced cognitive load. Participants were able to quickly grasp the function of the navigation arrows and complete the task with ease. The onboarding process facilitated a smoother user experience, resulting in higher satisfaction and efficiency.
User Feedback: Users appreciated the onboarding animation, stating that it provided clear and concise instructions. They felt more confident in using the tool and found the overall experience more intuitive.
Conclusion: The onboarding animation proved to be highly effective in reducing cognitive load and enhancing user understanding of the navigation arrows' functionality. Implementing such onboarding solutions can significantly improve usability and user satisfaction.
Conclusion
1. Minimize Cognitive Load:
Achieved Objective: The final design successfully minimized cognitive load through an intuitive user interface. Usability testing indicated that users could effortlessly navigate through complex organizational structures. The introduction of an onboarding animation significantly improved user understanding and reduced confusion, as evidenced by a 100% task completion rate in post-onboarding usability tests.
2. Optimize for Mobile Experience:
Achieved Objective: The responsive design provided a seamless and efficient user experience on mobile devices. Users reported high satisfaction with the mobile interface, noting its ease of use and clear visualization of organizational hierarchies. Mobile usability was prioritized, catering to the increasing number of users managing their organizations on-the-go.
3. Improve Efficiency:
Achieved Objective: The workflow for managing organizational hierarchies was streamlined, reducing the time and effort required for administrative tasks. Tools designed to enhance overall business productivity and decision-making proved effective, with users reporting improved efficiency in managing their organizations.
Conclusion: The design project successfully met all the outlined goals. The intuitive user interface, optimized mobile experience, improved efficiency, and robust SaaS-based B2B solution collectively contributed to a high-quality product that satisfied user needs and expectations. The combination of thorough user testing and iterative design improvements ensured the project’s success in achieving its objectives.